Running the Pipeline
This pipeline converts dietary data (e.g., FFQs) and microbial gene information into a graph structure for analyzing metabolic interactions between food and gut microbes.
Overview
graph LR
  A[FFQ / Food List] --> B[Compound Source]
  B --> C1[FooDB Workflow]
  B --> C2[Whole Genome Workflow]
  C1 --> D[Graph Data]
  C2 --> D
  D --> E[Pattern Extraction]
E --> F[Visualization]| Step | Description | Required |
|---|---|---|
| 1 | Launch Streamlit app to create machine-readable FFQ | Optional |
| 2 | Choose compound source (FooDB or KEGG) | ✅ |
| 3A/3B | Generate nodes and edges | ✅ |
| 4 | Microbial compound report | Optional |
| 5 | Build graph and extract patterns | ✅ |
| 6 | Visualize results | Optional |
Step 1 — Create a Machine-Readable FFQ
Food Frequency Questionnaires (FFQs) capture how often participants consume specific foods, but they aren't directly usable in computational workflows due to format heterogeneity, lack of molecular resolution, and inconsistent structure.
A Streamlit app is provided to generate standardized, machine-readable FFQ datasets that map food items to compounds via FooDB or KEGG.
streamlit run src/get_foods.py
In the app: 1. Search for and select foods 2. Assign a consumption frequency (1–100%) 3. Download the generated dataset 4. Shut down the application
No FFQ? No problem.
You can run the pipeline using all foods available in FooDB. Skip food metadata
creation in Step 3A, or pass the foodb and all-foods flags in the workflow runner.
Food compound reports are skipped due to dataset size.
Step 2 — Choose a Compound Source
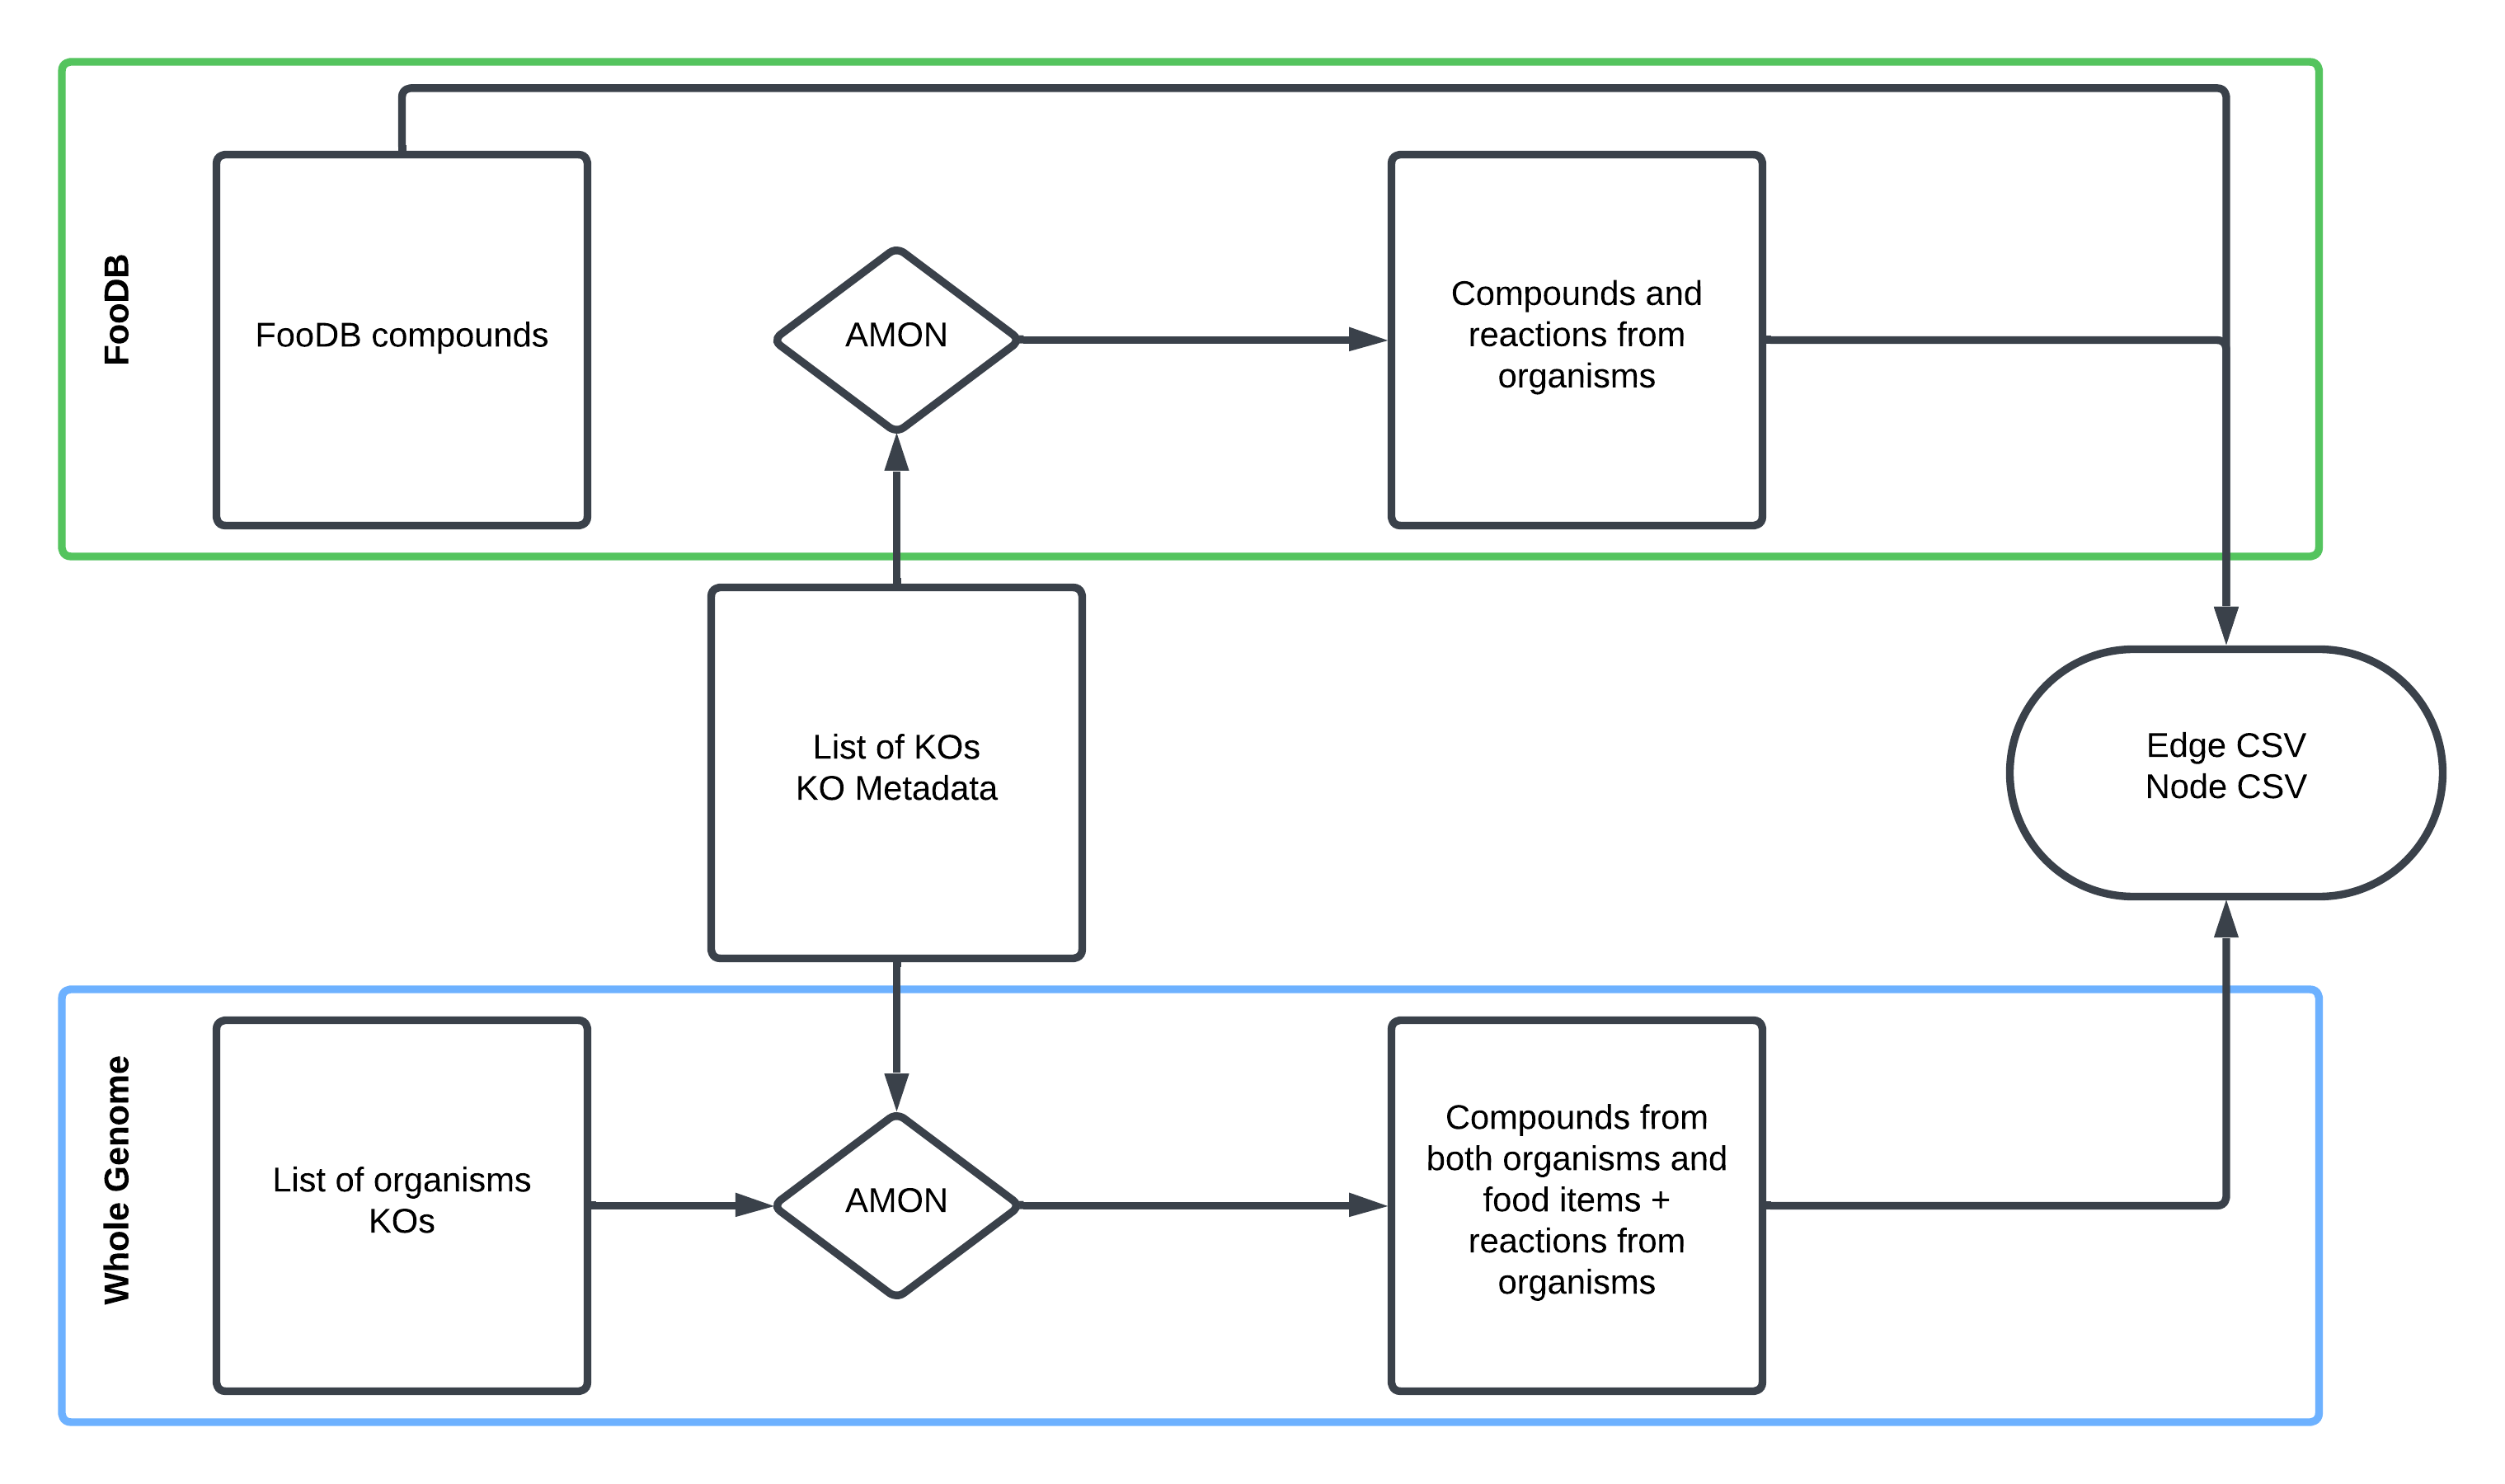
Option A: FooDB (Experimental)
FooDB contains compounds identified in foods via LC-MS experiments, many of which link to KEGG. Core metabolic compounds (amino acids, sugars, fatty acids, nucleotides) are well-represented, but specialized plant compounds (flavonoids, alkaloids, terpenes) may be missing.
Limitations: Incomplete compound coverage · Limited food representation · U.S.-centric food data
Option B: KEGG Whole Genomes (Genome-Based Prediction)
Compounds are inferred from an organism's genome based on its metabolic capabilities using KEGG organism data.
Limitations: Requires decomposing complex foods into components · Doesn't account for ripeness or cooking · Predictions may not reflect actual composition
Note
AMON takes a list of KOs and finds producible compounds via KEGG reactions, assigning their origin (dietary vs. microbial).
Step 3A — FooDB Workflow
1. Generate Food–Compound Metadata
Skip this step if using all FooDB foods —
Data/AllFood/food_meta.csvis pre-built.
Rscript src/Metabolome_proc/comp_FoodDB.R \
  --diet_file  "Data/test_sample/foodb_foods_dataframe.csv" \
  --content_file "Data/Content.csv" \
  --ExDes_file "Data/CompoundExternalDescriptor.csv" \
  --meta_o_file "food_meta.csv"
Output: Food items mapped to KEGG compound IDs with aggregated consumption frequencies.
2. Generate Food Compound Report (optional)
Skip if using all foods — the dataset is too large.
python src/Metabolome_proc/RenderCompoundAnalysis.py \
  --food_file "food_meta.csv" \
  --output "food_compound_report.html"
3. Run AMON
amon.py \
  -i "Data/test_sample/noquote_ko.txt" \
  -o "AMON_output/" \
  --save_entries
4. Create Graph Data
python src/Metabolome_proc/main_metab.py \
  --f "food_meta.csv" \
  --r "AMON_output/rn_dict.json" \
  --m_meta "Data/test_sample/ko_taxonomy_abundance.csv" \
  --e-weights \
  --n-weights \
  --org \
  --a "Abundance_RPKs" \
  --o "graph/"
Step 3B — Whole Genome Workflow
1. Map Organisms to KOs
python src/WholeGenome_proc/comp_KEGG.py \
  -i "Data/test_sample/kegg_organisms_dataframe.csv" \
  -k "org_KO/" \
  -o "food_item_kos.csv"
2. Run AMON
amon.py \
  -i "Data/test_sample/noquote_ag_sample.txt" \
  -o "AMON_output/" \
  --other_gene_set "org_KO/joined.txt" \
  --save_entries
3. Create Graph Data
python src/WholeGenome_proc/main_geno.py \
  --f_meta "food_item_kos.csv" \
  --m_meta "Data/test_sample/ko_taxonomy_abundance.csv" \
  --mapper "AMON_output/kegg_mapper.tsv" \
  --rn_json "AMON_output/rn_dict.json" \
  --e-weights \
  --n-weights \
  --org \
  --a "Abundance_RPKs" \
  --o "graph/"
4. Generate Food Compound Report
python src/WholeGenome_proc/RenderCompoundAnalysis.py \
  --node_file "graph/WG_nodes_df.csv" \
  --output "food_compound_report.html"
Step 4 — Microbial Compound Report (optional)
Requires microbial taxonomy and abundance data.
python src/RenderCompoundAnalysis_Microbe.py \
  --node_file "graph/nodes.csv" \
  --edge_file "graph/edges.csv" \
  --output "microbe_compound_report.html"
Step 5 — Build Graph and Extract Patterns
python src/run_graph.py \
  --n "graph/nodes.csv" \
  --e "graph/edges.csv" \
  --o "graph_results.csv"
Patterns identified:
| Pattern | Description |
|---|---|
| Food → Microbe | Compound produced by diet, consumed by microbe |
| Food → Both | Compound shared between diet and microbial production |
| Both → Both | Compound produced and consumed across both sources |
Step 6 — Visualize Graph Results
python src/RenderGraphResults_Report.py \
  --patterns "graph_results.csv" \
  --rxn_json "AMON_output/rn_dict.json" \
  --output "graph_results_report.html"
Note
Steps 2–4 correspond to the general workflow described on the home page.
Tip
Use run_workflow.py to run Steps 3–4 automatically. See the
Quick Start guide for a complete example.